The State of the Industry Report: U.S. EV Fast Charging — Q1 2025 offers an in-depth analysis of the evolving EV DC fast charging (DCFC) landscape.
“Despite some high-profile setbacks, the industry made real strides last year,” said Bill Ferro, CTO at Paren. “Paren’s U.S. Reliability Index measured an improvement versus Q4 2024 of 81.2 points to 82.6, an increase of 1.7%. This continues a quarterly trend across the U.S. non-Tesla fast charging infrastructure, which suggests that the ongoing efforts to replace or sunset older hardware is having a positive impact on station uptime. In addition, newer entrants into the field are bringing time-tested hardware along with enhanced driver experiences.”
Reliability
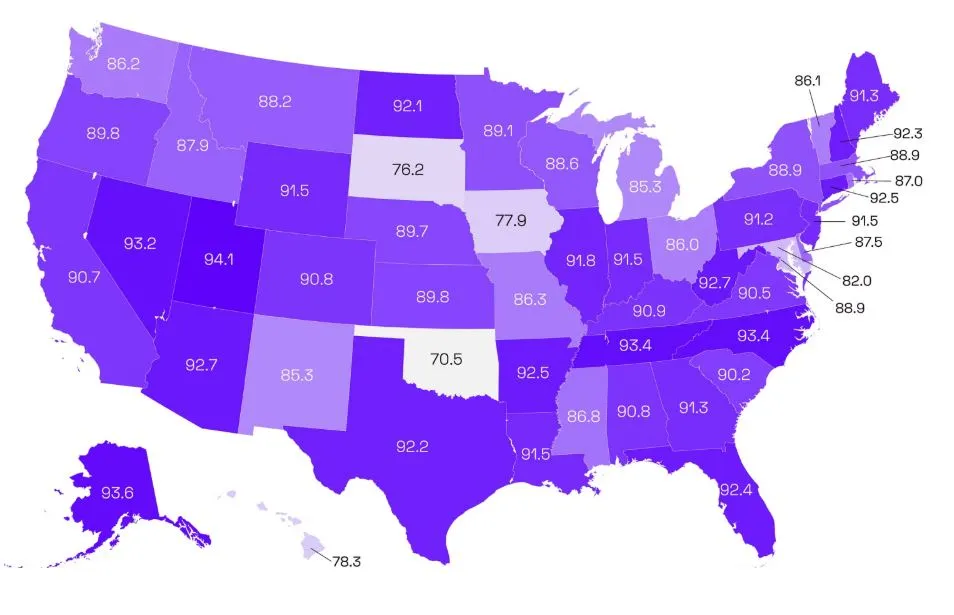
Paren's US Reliability Index provides a standardized view of fast charging network performance over time, capturing operational uptime and early indicators of system failure. This index helps identify how consistent and dependable public fast charging infrastructure is for US EV drivers. Paren tracks the reliability of the Tesla Supercharger network, but as it is known to be highly reliable, the index in this report will focus just on the non-Tesla networks.
In Q1 2025, the US Reliability Index saw a significant improvement versus Q4 2024 of 1.4 points to 82.6, an increase of 1.7%. This improvement, which has been a recent trend across the non-Tesla fast charging networks, suggests ongoing efforts to stabilize and improve station uptime is working. Some factors driving higher reliability include:
- In 2024, some major players slowed the opening of new fast-charging stations while they worked on improving the reliability of existing stations and assessed new and more reliable hardware options.
- Stronger performance and quality of new stations being built by major new players entering the market, and to a lesser but growing impact, new stations funded under the NEVI program.
- Maintenance programs have now become front and center, with CPOs requiring heightened SLAs with shorter response times and higher uptime. The above shifts are part of a larger transition of the fast-charging industry from a "race to get chargers in the ground"—to a focus on a stellar charging experience and achieving profitability.
The report's other key findings include that total new ports (charging connections) grew to 55,580 at the end of Q1, an increase of 3,667 and stations (locations) reached 10,839, an increase of 794 in Q1. The number of new ports and stations added in Q1 were fewer than in Q4 2024 — a normal seasonal trend resulting from winter weather slowing construction in Q1, following year-end rushes to open new stations.
Utilization

Average utilization (minutes of charging session time as a percentage of time a station is open each day) across the U.S. also declined slightly to 16.2% from 16.6% in Q4 2024. Q1 2025’s small decline is a result of the typical Q4 bump caused by growing EV travel during the Thanksgiving and Christmas travel periods. However, utilization is trending up, especially in dense urban coastal markets with high rideshare and apartment renter households that depend on public charging.
Analyzing utilization rates by MSA (Metropolitan Statistical Area) paints a more insightful picture versus by state, but not surprisingly markets with the highest utilization rates tend to share traits including high renter population, high EV penetration, heavy rideshare usage, and are travel destinations.
Las Vegas topped the list of MSAs (Metropolitan Statistical Areas) with an average utilization rate of 34.1%, followed by Los Angeles (31.4%), New York (27.6%), and Miami (27.2%). These high-demand regions highlight where station capacity may need to scale in the future to keep pace with usage.
On the other end of the spectrum, MSAs like Columbus (6.8%), St. Louis (9.0%), and Minneapolis (9.3%) experienced far lower utilization, signaling either excess infrastructure and/or lagging demand. This contrast reinforces the need for CPOs to implement very hyper-localized deployment strategies that match actual charging behavior, local demographics, and EV adoption patterns.
Because of low utilization and demand in rural markets and stretches of long highway corridors in some states, CPOs have tended to avoid building infrastructure in these areas. This is exactly what the National Electric Vehicle Infrastructure (NEVI) program was intended to address. Its current pause and uncertainty in the future means that many CPOs will continue to focus on medium- to high-utilization markets, resulting in concerns about being able to take long road trips by some current and potential future EV drivers.
A significant and encouraging rise in the average ratio of ports per station among non-Tesla networks to 3.9 from 2.7 in Q1 2024. For context, the Tesla Supercharger network now averages 13.0 ports per station, and the National Electric Vehicle Infrastructure (NEVI) program requires a minimum of four ports per station.
Tesla leads in ports per location
Data from Q1 2025 shows that Tesla stations continue to offer significantly more ports per location than non-Tesla networks, reinforcing the company's strategy of high-density, high-power charging hubs. Meanwhile, non-Tesla charging networks have shown gradual growth in ports per station, increasing accessibility but at a much lower scale compared to Tesla.
Over the past year, Tesla's ports per station have fluctuated each quarter, peaking in Q4 2024 at 15.2 before declining in Q1 2025 to 13.0. This decline is mostly due to Q4 2024 being an outlier with several large-port sites opening that quarter, including a 120-port site in Bartsow, California, a 52-port site in Illinois, and 48-and 38-port sites in Southern California. While Tesla still maintains a significantly higher ports per station ratio compared to non-Tesla networks, the company may increasingly focus on adding additional ports to existing stations, and filling in charging deserts with its typical 8- and 12-port sites.
Non-Tesla networks have steadily increased the average number of ports per station in response to a significant increase in utilization, especially in high-adopting EV markets. In Q1 2025, the average number of ports per station grew to 3.7, a significant increase of 37% from the 2.7 in Q1 2024. Non-Tesla networks are gradually increasing the typical number of ports per station, and closed the gap differential with Tesla to 9.3, from a gap of 10.1 in Q1 2024. On a multiple level, in Q1 2025 Tesla averaged 3.5 times as many ports per station versus non-Tesla networks, down from 4.7 in Q1 2024.
Understanding this metric helps assess whether new stations are being deployed to selectively meet rapidly increasing utilization, especially in busy urban markets with a high concentration of rideshare drivers and EV owners without access to charging where they live. As many CPOs start to rapidly scale their networks, the economics of larger charging stations and hubs is becoming more advantageous.
CCS dominance
Continued combined charging system (CCS) dominance: 59% of new ports were CCS-enabled, 31% NACS-enabled, and 10% CHAdeMO. However, only 104 of the newly added NACS (J3400) ports were at non-Tesla networks, showing the U.S. is still in the very early stages of the transition to the J3400 connector standard — meaning drivers of new non-Tesla vehicles coming to market this year with a NACS port standard will need to heavily rely on adapters.
Pricing models were evaluated with Fixed pricing being used by charge-point operators (CPOs) 80% of the time across the states, with the Time of Use (TOU) approach averaging 16%, and Time (e.g., by the minute or hour) rarely used at 4.2%.
Impact of NEVI program pause
Of significant concern to the industry and EV drivers is the potential negative impact of an extended pause of the NEVI program, which was designed specifically to fund the build out of charging infrastructure in rural and low-income communities where charging networks are typically not building new charging stations. “Our data is a harbinger of less expansion in rural and lower-income markets as CPOs will increasingly focus on urban markets seeing high utilization, often north of 30%, versus markets with less than 5% utilization,” said Loren McDonald, chief analyst at Paren.
The report concludes that 2024 will be remembered as a transformational year for the EV charging industry — one that signals a shift into what Paren is calling 'Charging 2.0'.
“2024 was a year of mixed news in the US. DC fast charging industry, but it will be remembered as a pivotal turn to a new era we are calling 'Charging 2.0'," said McDonald. “Charge-point operators and new players in the industry are increasingly focused on creating a great customer experience, improving reliability of chargers, and reaching profitability — a shift from chasing the availability of incentives, racing to get chargers in the ground, and then crossing your fingers that utilization will grow over time,” he added.